Some thoughts on the Global Historical Climate Network Daily (GHCN-D) Data
Introduction
The GHCN-D data is the primary source data for most land-based climate data bases. The data is accessible atThe data I collected includes three temperature measurements, TMAX, TMIN, and TAVG (the maximum observed temperature, the minimum observed temperature, and the average observed temperature) each measured in 10s of degrees Celsius, two snow measurements SNOW and SNWD (snow fall and snow depth on the ground) each in mm, and PRCP (precipitation) measured in mm.
In addition to the observed value for each variable, the data set includes three other variables: DM are flags for data measurement, QC are flags for data quality, and SF are source flags. The most important of these appear to be the quality flags.
All of this data has measurement error, especially going back in time. Many of the stations also suffer from problems such as urban heat island effects. There is also a claim that stations collected data at different times of day in the past, which may affect temperature measurements. While there are plenty of data sets that attempt to correct for these problems, including a monthly compilation of temperature data for TAVG in the GHCN-monthly data, the NASA/GISS data, the HadCrut data, and the Berkeley Earth data, I will focus here only on the GHCN-daily files, which contain "raw" data.
Station Locations
The total number of stations in the GHCN-D file is 124,954. The precipitation data is reported for 122,772 stations. The snow data is reported for 83,230 stations. The temperature data is reported for 40,637 stations. Only 28,668 stations contain precipitation, snow, and temperature data. Each station contains data on its geographical location (latitude and longitude), its elevation, which country it is located in, and the station name.
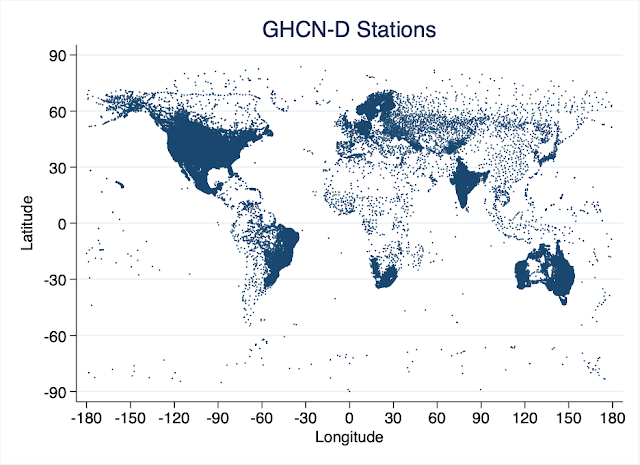
The following shows the distribution of stations across the planet:
As one can see, the density of stations is highest in North America, Northern Europe, Australia, western South America, and India. There are few stations in Antarctica, but there are also station deserts in Saharan Africa, central-western Australia, northern Canada and northern Russia. North America is most over-represented, with 85,787 (68.7%) stations located in the US, Canada, or Mexico. Oceana, dominated by Australia, has 17,318 (13.9%) stations. Europe has 6,857 stations; South America has 6,878 stations; Asia has 5,820 stations, Africa has 2,192 stations, and Antarctica has only 102 stations.
The next graph shows the distribution of stations containing temperature data. Stations in blue contain temperature data. Stations in black do not. As can be seen, many stations in South America, Southern Africa, India, Australia, and south-central Russia are missing temperature data.
A similar thing occurs with snow stations, though the reporting is clearly more tied to whether snow occurs. Finland, however, is an interesting exception.
Special Networks
The GHCN-D data contains indicators to three "high quality" sets of stations. The GSN network contains up to 991 stations globally. It's distribution is shown below:
The HCN network is a set of 1,218 U.S. stations in the contiguous 48 states. Both the GSN and HCN network of stations have data going back to the earlier parts of the data.
The CRN network is a more recent network, with 232 stations in the U.S, one in Ontario, Canada, and one in Russia.
Number of Stations over Time
While the previous graphs give a good idea of how stations are distributed across geography, they do not tell us how the number of stations vary over time. The next figure shows this in a graph with the number of stations since 1890 by network (GHCN-D, GSN, HCN, and CRN) and by data type (precipitation, snow, and temperature). The number of stations is on a log-scale.
Three things to observe. First, the GSN and HCN data sets extend back as far as the GHCN-D ("Total"), though the numbers are smaller by about two orders of magnitude. The CRN data only began in 2001. Second, the total number of stations at any point in time never exceeds about 40,000 stations for precipitation, and less than 20,000 for temperature data. This means that stations are both disappearing and arriving in the data. That complicates things in terms of station records, since new stations are more likely to be setting new records. Third, the total number of stations over time is not monotonically increasing. The number of stations reporting precipitation data peaked in the 1970s, and the number of stations reporting temperature data peaked around 2000. The number of stations in the GSN, HCN, and CRN networks also exhibit peaks in the number of stations reporting over time for all three measures.


Comments
Post a Comment